Deeper Dive to Concentration and Overvaluation
Market Returns Concentrated in a few stocks
The rise in U.S. stocks during the first 4 months of 2021 were spread across a large segment of the market. Industries such as the beaten down Energy complex and Value stocks across the Large, Mid, and Small-Cap market segments powered the early growth in 2021. During the second half of the year the tried-and-true technology stocks that have come to dominate the market pushed the broad indexes to 20%+ gains by the end of the year. A study by Goldman Sachs showed that five stocks; NVIDIA, Microsoft, Apple, Alphabet, and Tesla accounted for more than 50% of the gains in the last 7 months of the year.
The 5 stocks we just highlighted have achieved incredible growth and if you look at the performance more broadly over the last ten years, the returns have been truly staggering. The chart below shows the cumulative returns achieved during the last ten years as well as their annual rates of return.

Has this happened before?
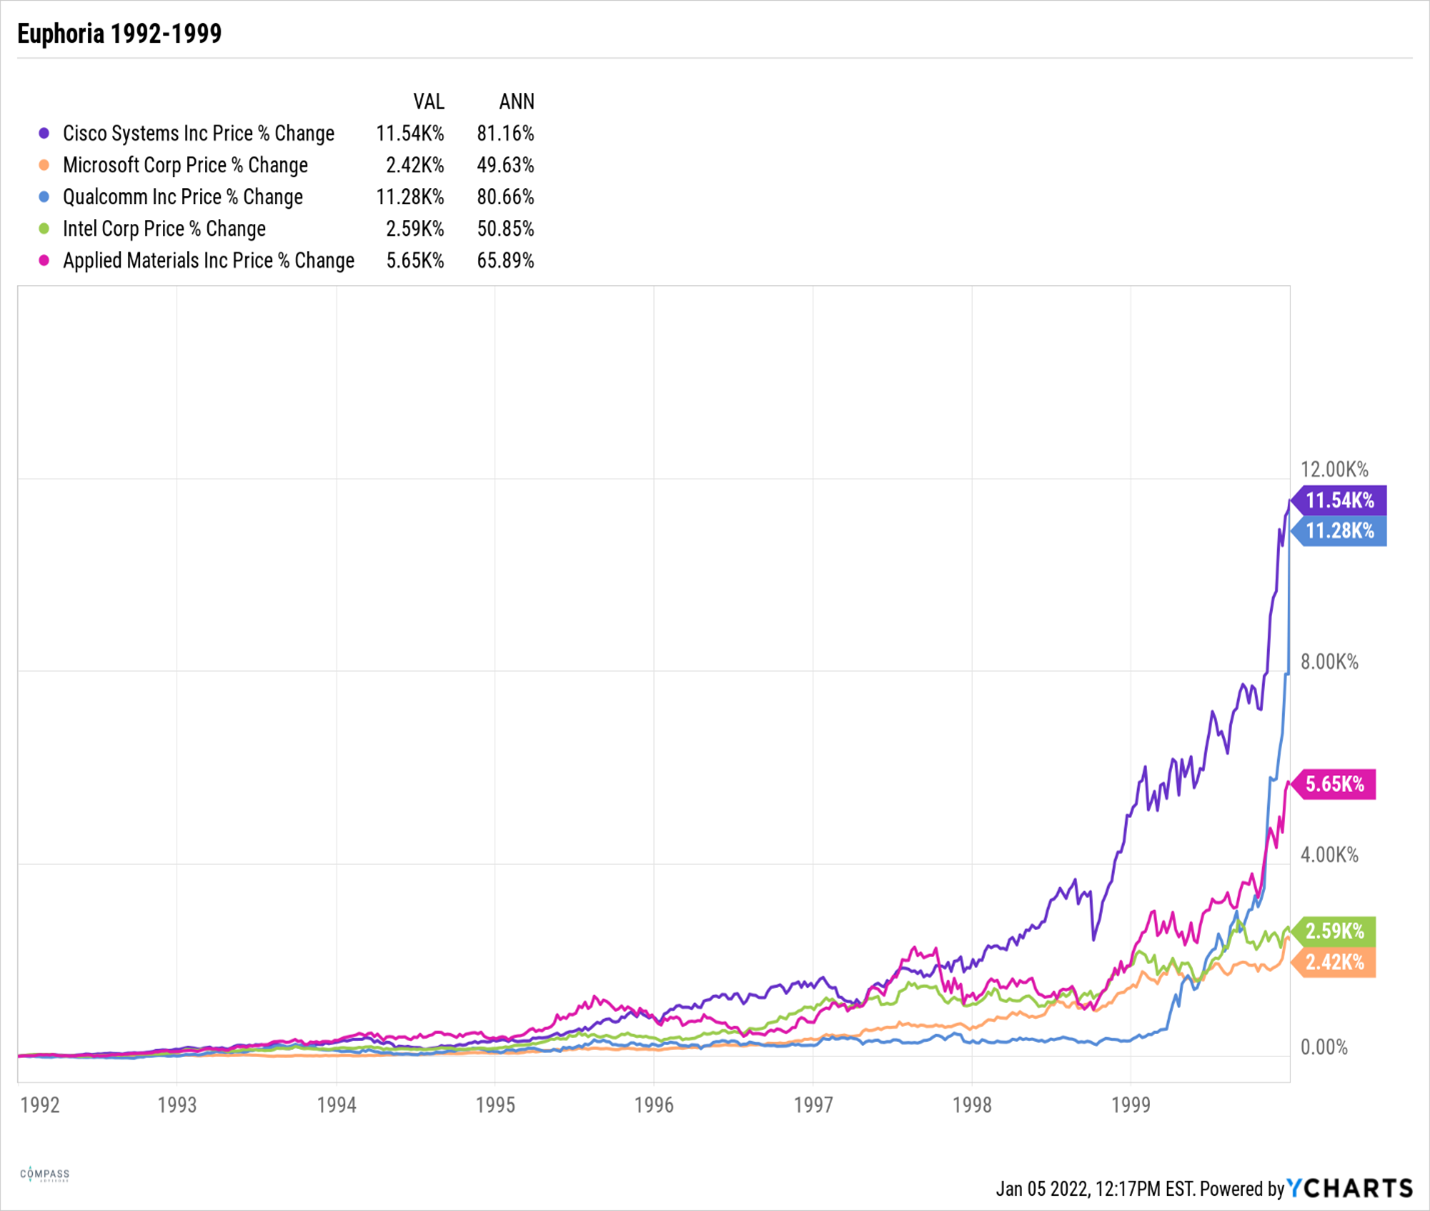
With the benefit of hindsight, we can go back and look at the charts of stocks that have showed similar growth. The most recent example would be the performance of technology stocks during the 1990’s, and if we went back further to the 1970’s, we could see similar behavior in what were referred to as the “Nifty Fifty.”
Below is a chart showing 5 technology stocks that grew extraordinarily between 1992 and 1999. These stocks become concentrated in the S&P 500 and the Nasdaq and helped to power 20%+ average gains in the S&P 500 for most of the mid to late 90’s. The defining characteristic of both charts, the stocks of today and the stocks from the 1990’s, is the relatively flat and normal growth followed by a sharp and rapid rise to the top right of the graph.
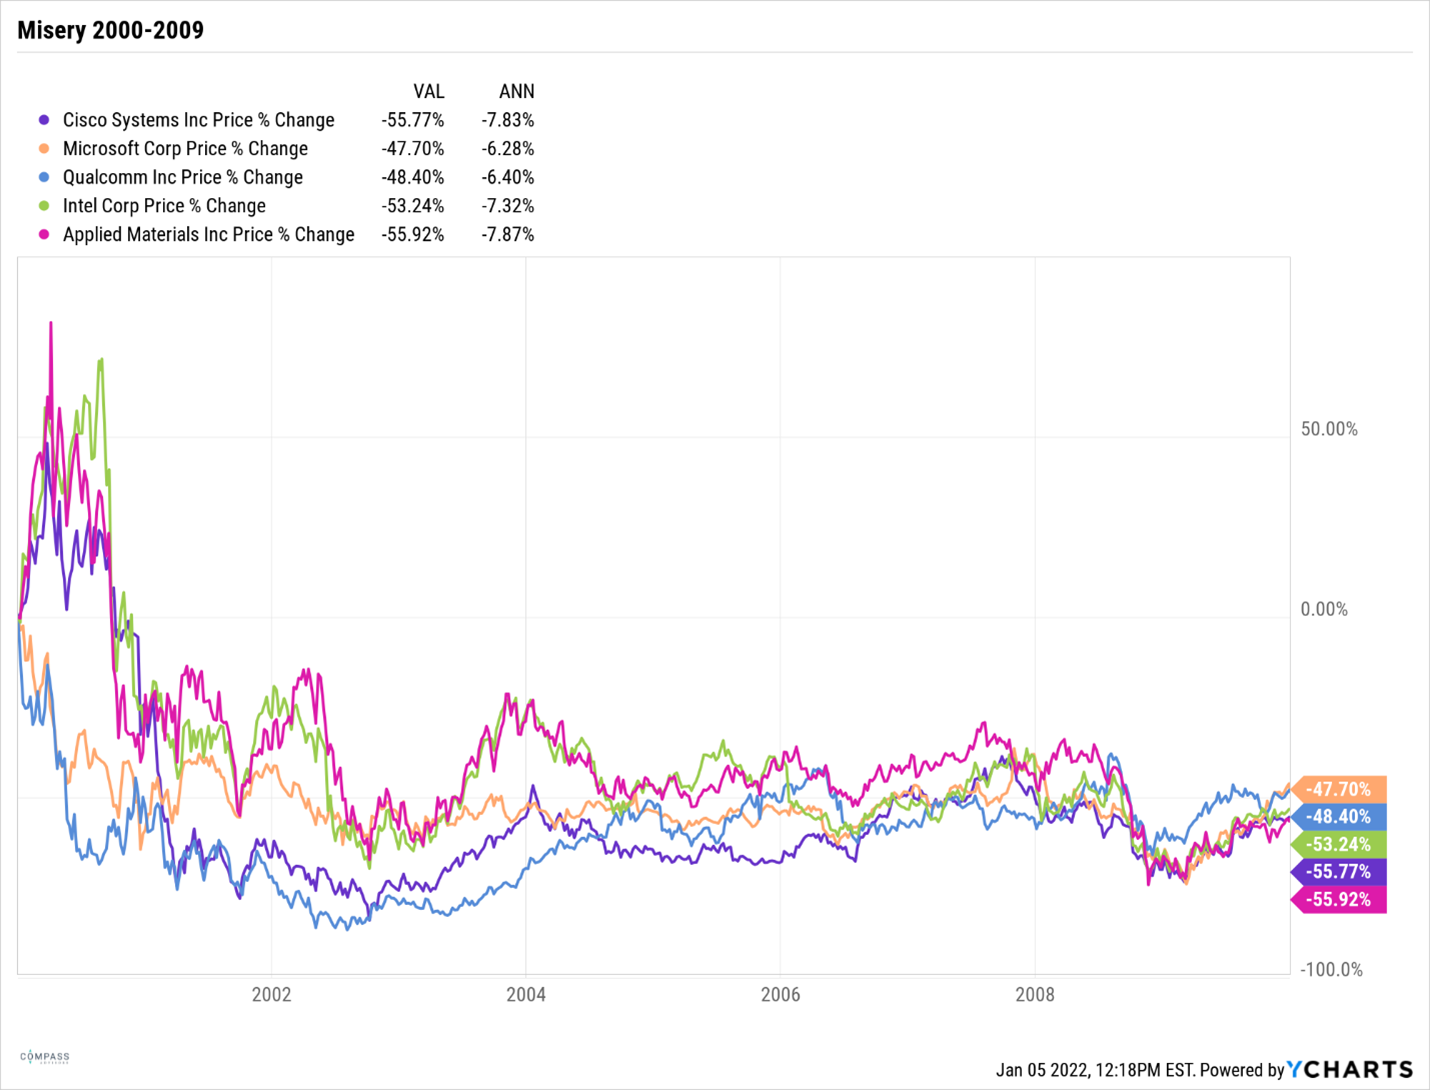
What happened to the Technology Stocks of the 90’s?
Most of those stocks are still excellent and strong companies that have performed very well, especially recently. Microsoft is featured on both charts; Cisco is still a strong company as is Intel and Applied Materials. Even though those companies are strong and resilient companies, there was a reckoning and resetting in their share prices following the massive and historic growth achieved during the 1990’s.
The chart below shows the performance of those stocks during the 10 years of the 2000’s. The result of overvaluation in those stocks was massive losses during the year 2000 with sideways growth that lasted for the better part of a decade.